Introduction
Gold has long been a symbol of wealth and stability, captivating the hearts of people and the strategies of investors. With its shimmering allure, gold’s pricing trends offer a fascinating glimpse into the dynamics of global finance, geopolitical influences, and investor sentiment. This article delves into the nuanced world of gold prices, examining their fluctuations over different time frames: monthly, daily, and annually, alongside a comparative analysis of opening, low, and high averages over the years.
Monthly Gold Price Averages Reveal Seasonal Patterns
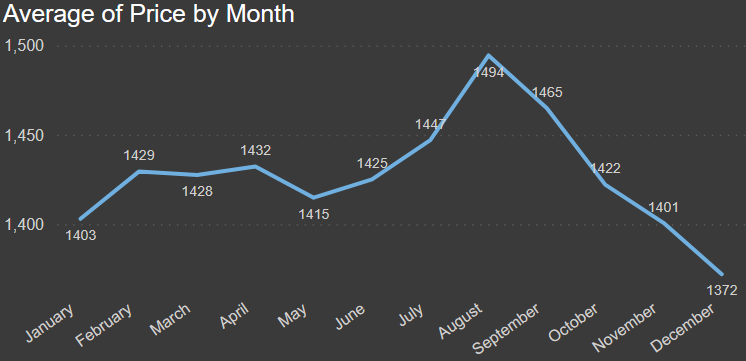
A detailed look at the average monthly gold prices unveils a story of seasonal fluctuations and investor reactions to global economic events. Beginning the year, January presents an average price of $1403.05, with a steady climb peaking in August at $1494.45. This mid-year surge reflects a trend where investors often turn to gold as a hedge against the volatility of other investment classes during uncertain economic times.
The descent from September, with an average of $1464.91, to December’s $1372.06, illustrates a seasonal recalibration, as investors rebalance portfolios and cash in on the year’s gains. Such patterns underscore the nuanced strategies employed in gold investments, balancing between speculative gains and its role as a financial safe haven.
Daily Maximum Prices Highlight Key Market Movements
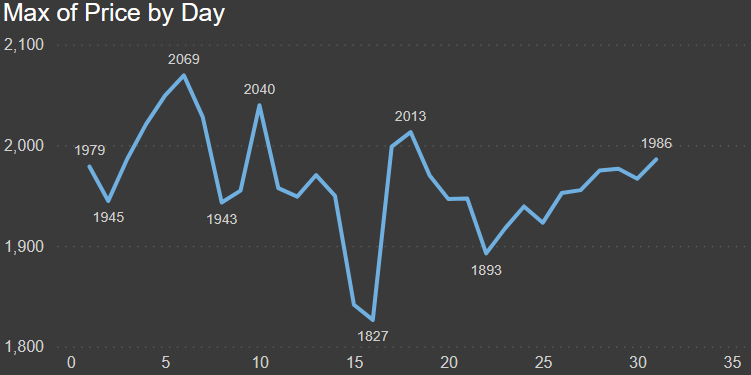
The analysis of daily maximum gold prices within a given month showcases significant market movements and investor sentiment. Notably, the price peaks on the 6th day of the month at $2069.4, marking a day of intense investor interest possibly tied to specific geopolitical events or economic announcements. This daily snapshot reveals the acute sensitivity of gold prices to immediate global events, underscoring its role as a reactive asset in investment portfolios.
Yearly Averages Chart a Decade of Growth and Volatility
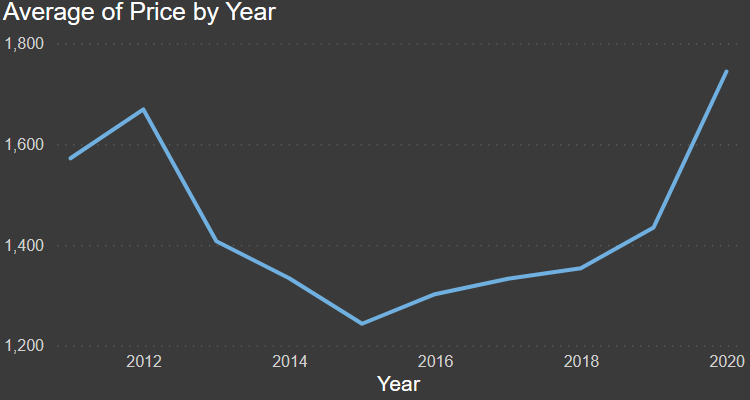
Spanning a decade, the yearly average prices of gold present a broader perspective on its long-term valuation trends. From $1572.14 in 2011 to a significant rise to $1744.51 in 2020, the trajectory indicates a robust increase, punctuated by periods of volatility reflective of broader economic trends and uncertainties. The years 2011–2012 and 2020 highlight peaks in average prices, correlating with times of economic distress or significant monetary policy shifts, reinforcing gold’s reputation as a refuge asset.
Comparative Analysis of Opening, Low, High Averages
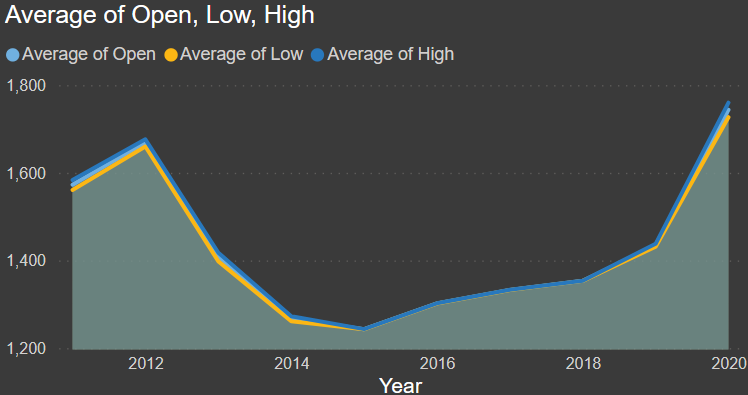
The comparative analysis of the opening, low, and high averages across different years offers insights into the market’s behavior and investor sentiment. For instance, the relatively narrow spread between these averages in 2015 versus the wider spread in 2020 suggests periods of greater market stability versus those of heightened volatility and uncertainty. This variance not only impacts investment strategies but also reflects the global economic environment’s influence on gold prices.
Conclusion
The intricate dance of gold prices through time illuminates the complex interplay between investor sentiment, global economic events, and market speculation. Whether viewed through the lens of monthly averages, daily maximums, or annual trends, gold continues to fascinate and function as a critical component of investment portfolios. As we navigate through the currents of global finance, gold remains a beacon of stability and a mirror reflecting the world’s economic health.