Link to dashboard –> https://aurelvlad7.grafana.net/public-dashboards/c670db80a526480e9cf7caa59bf29cb2
Introduction
Indoor air quality is a significant concern for homeowners, office workers, and facility managers. A well-monitored indoor environment not only provides comfort but can also have a substantial impact on health and well-being. The dashboard screenshot shared with us offers a glimpse into the intricate dance of various environmental parameters and their interplay throughout the day. Let’s dive into what the data tells us and how it can be leveraged for healthier living spaces.
The Metrics That Matter
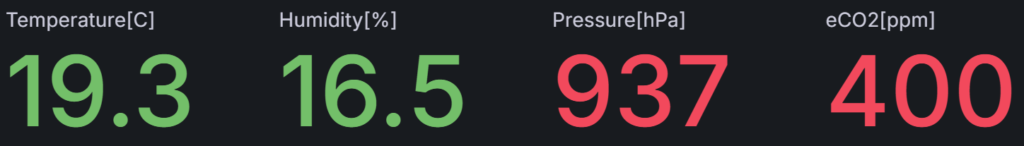
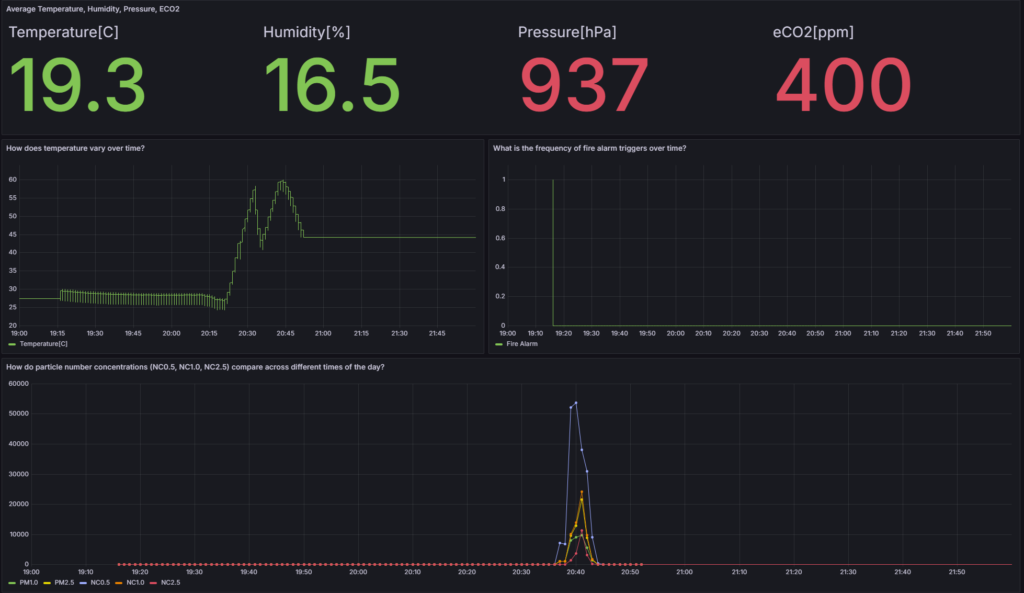
The dashboard presents real-time monitoring data for average temperature, humidity, pressure, and estimated CO2 (eCO2) levels. It’s split into four key metrics at the top, with two detailed graphs analyzing temperature variance and particle number concentrations over time, alongside a chart for fire alarm triggers.
Temperature and Comfort
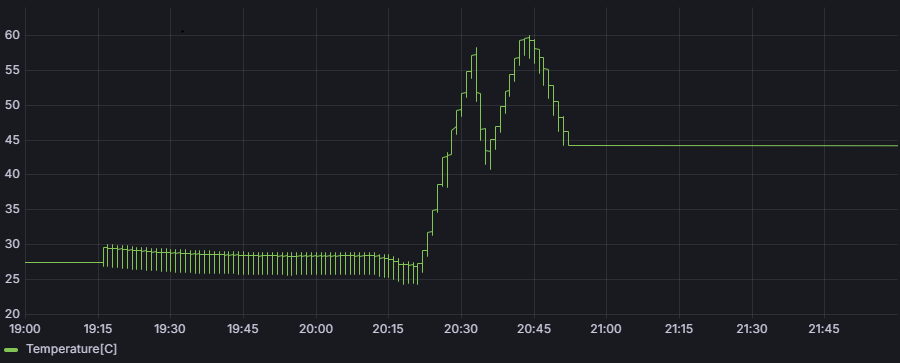
At a glance, the temperature reads at a comfortable 19.3°C. The temperature trend shows fluctuations, peaking at just above 55°C. Such a spike might indicate a temporary heat source or an error in measurement. It’s crucial to maintain a stable temperature for comfort and to prevent the proliferation of harmful organisms that thrive at higher temperatures.
Humidity and Health
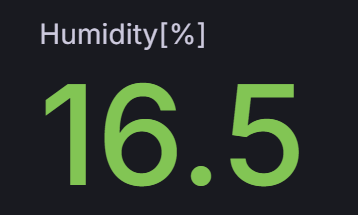
With humidity at 16.5%, the air is on the drier side. Low humidity levels can lead to dry skin, irritation of the respiratory tract, and can exacerbate allergies and asthma. Keeping indoor humidity between 30–50% is recommended to avoid these issues and inhibit the survival of flu viruses.
Pressure and Ventilation
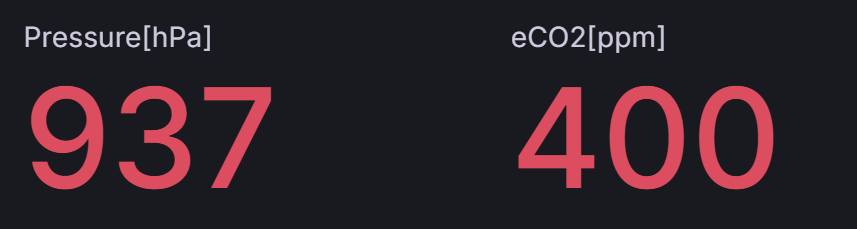
A pressure reading of 937 hPa falls within the typical atmospheric pressure range at sea level, indicating that the indoor space is likely well-ventilated. Sudden changes in pressure could suggest alterations in indoor air quality due to external factors, such as opening doors or windows, or the activation of HVAC systems.
The eCO2 level stands at 400 ppm, which is generally considered a good level, indicating adequate ventilation. Higher levels of CO2 can lead to drowsiness, headaches, and reduced cognitive function. Monitoring CO2 is therefore essential for ensuring that indoor spaces have enough fresh air circulation.
Particulate Matter and Fire Alarms
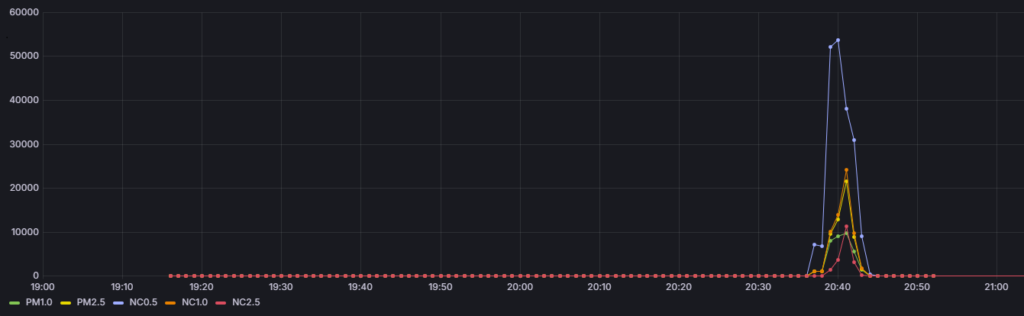
The lower part of the dashboard displays the concentrations of various particle sizes (PM1.0, PM2.5, NC0.5, NC1.0, NC2.5) and the frequency of fire alarm triggers. Notably, there’s a significant spike in small particle numbers around 20:30. This coincides with a solitary fire alarm trigger, suggesting a possible minor combustion event (like burnt food) that was quickly contained.
What Can We Learn?
The data presented in this dashboard are valuable for making informed decisions about air quality management. Here are some key takeaways:
- Temperature regulation is vital for comfort and health. Smart thermostats can help maintain an optimal range.
- Humidity levels need to be monitored, especially during winter months, to ensure they stay within a healthy range.
- Pressure readings can inform us about the effectiveness of ventilation systems.
- eCO2 levels serve as proxies for air quality and should be kept low through proper ventilation.
- Particle concentration data is crucial for detecting pollution sources, potential allergens, or even fire hazards as early as possible.
Final Thoughts
This real-time data monitoring dashboard serves as an eye-opener to the dynamic environment indoors. By paying close attention to these parameters, we can create healthier, more comfortable, and safer indoor spaces. Continuous monitoring and smart controls are the keys to achieving and maintaining optimal air quality in our daily environments, contributing to our overall health and well-being.