Introduction
The modern workforce is a dynamic and ever-evolving landscape, with employee attrition being an intrinsic part of this perpetual motion. By scrutinizing the ebb and flow of employee turnover, organizations can unveil patterns and insights critical for crafting robust retention strategies. Our latest data exploration sheds light on the attrition trends within a composite organization, paving the way to understanding the multifaceted nature of employee retention and turnover.
Business Travel and Attrition
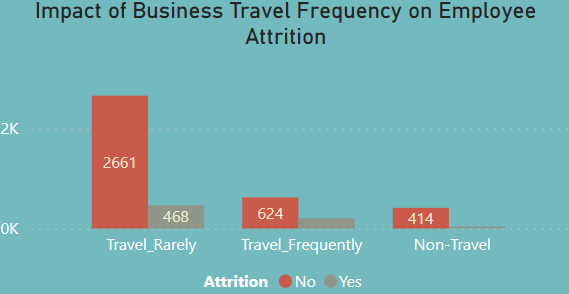
A remarkable observation surfaces when considering the frequency of business travel. Employees who ‘Travel Rarely’ comprise the majority, with 2,661 not facing attrition, while 468 do. On the contrary, ‘Travel Frequently’ employees exhibit a proportionally higher attrition rate, with 207 out of 831 employees opting out of their roles. ‘Non-Travel’ employees show a staunch loyalty, with only 36 out of 450 experiencing attrition. This datum points to a potential correlation between travel frequency and job stability, a vital consideration for organizations looking to bolster their retention rates.
Salary Hikes and Retention
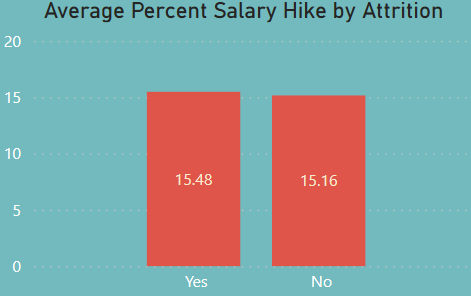
When dissecting the impact of salary hikes on retention, an intriguing trend emerges. Employees who stayed within the organization enjoyed a slightly lower average percent salary hike of 15.16% compared to 15.48% for those who left. This subtle difference prompts questions about the role of financial incentives in employee satisfaction and longevity.
Gender Representation and Departmental Breakdown
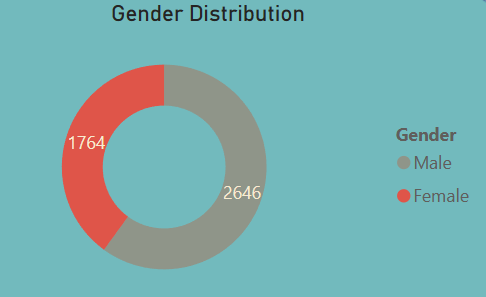
Diving into the gender demographics reveals that males account for 2,646 of the workforce, while females represent 1,764. A departmental analysis shows a significant leaning towards Research & Development with 2,883 employees, followed by Sales at 1,338, and a modest 189 in Human Resources. Such insights could guide targeted engagement and development programs within departments exhibiting higher attrition rates.
Job Roles and Longevity
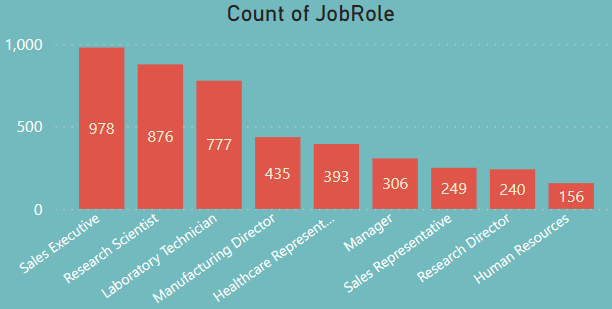
Analyzing roles, ‘Sales Executive’ leads with 978 counts, ‘Research Scientist’ at 876, and ‘Laboratory Technician’ at 777, highlighting areas where attrition could be most impactful. In terms of tenure, varying job levels within departments like Research & Development and Sales showcase employees with substantial longevity, some boasting up to 40 years at the company and 15 years since the last promotion, indicating potential areas for recognizing and leveraging extensive institutional knowledge.
Conclusion
The data narrative weaves a compelling story of the various factors influencing employee attrition. From the impact of business travel to the nuanced effect of salary hikes, gender representation, departmental make-up, and job role longevity—the confluence of these elements forms a complex tapestry that requires thoughtful analysis and strategic action.
The proposed Power BI dashboard portfolio will transform these insights into a visual narrative, allowing stakeholders to interact with the data in a meaningful way. Through this lens, we can not only witness the historical trails of employee movement but also forecast and mold the future landscape of workforce management. With the right blend of visual analytics, we can turn raw data into a strategic asset for driving employee engagement and retention in the modern workplace.