Link to dashboard —- »> https://aurelvlad7.grafana.net/public-dashboards/6d408868ec66426bbc74d3a18fb36e38
Introduction
In the world of smart buildings and efficient space management, understanding room occupancy patterns is crucial. Thanks to IoT (Internet of Things) sensor technology, we can now gather comprehensive data on environmental parameters that indicate human presence. In this blog post, we delve into recent data captured by IoT sensors to unearth the occupancy trends in a specific room.
A Snapshot of Environmental Conditions

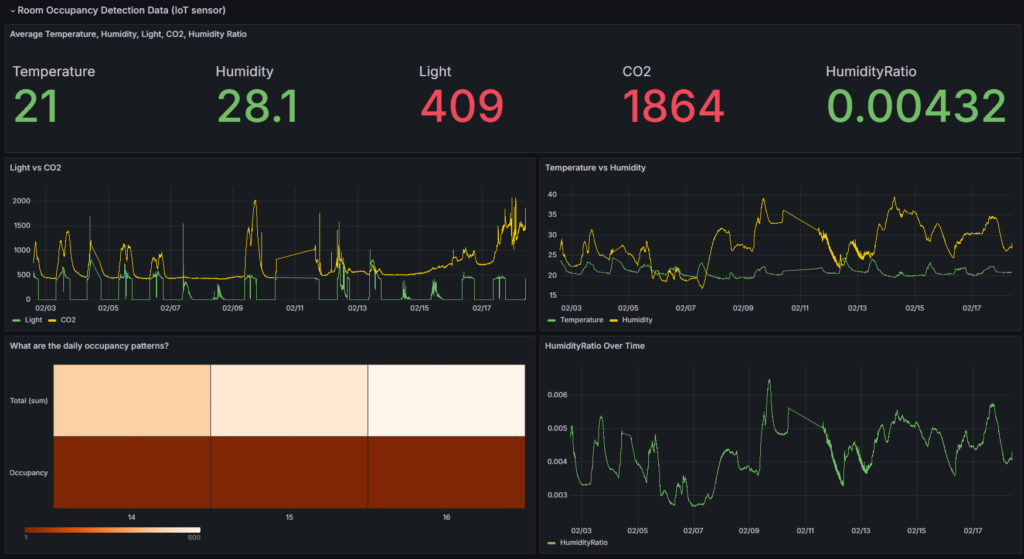
Before interpreting occupancy, let’s consider the environmental conditions. The average readings from our IoT sensors are as follows:
- Temperature: 21°C — A moderate and comfortable temperature indicating a controlled environment.
- Humidity: 28.1% — This is relatively low, suggesting an indoor setting possibly with air conditioning.
- Light: 409 lux — Indicative of indoor lighting conditions during working hours.
- CO2: 1864 ppm — Significantly high, likely pointing to a shared space with multiple occupants.
- Humidity Ratio: 0.00432 — This ratio, which combines temperature and humidity, confirms the conditions conducive for human comfort.
Light vs. CO2
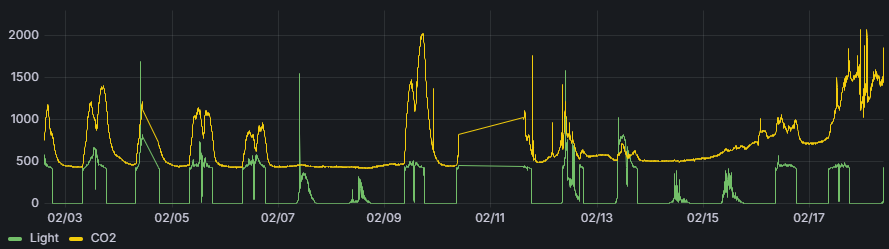
Fluctuations in light and CO2 levels are immediate indicators of room usage. The graph shows a clear pattern of light usage, with spikes that often coincide with increases in CO2 levels, suggesting that these moments are when the room is most occupied.
Temperature vs. Humidity
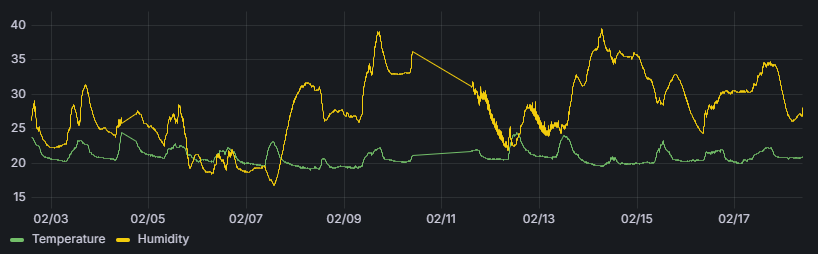
The interplay between temperature and humidity is less direct but still telling. A relatively stable temperature alongside varying humidity levels could indicate the use of HVAC systems responding to occupancy levels.
Occupancy Patterns: Reading Between the Lines
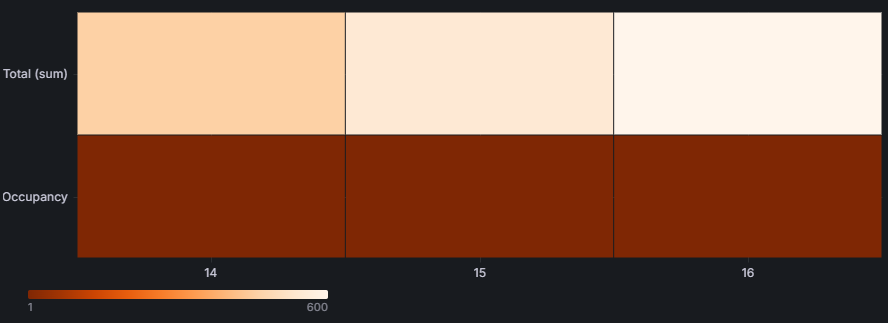
The most direct data comes from the occupancy heatmap. Over a span of three days, we see that the room has the highest occupancy on day 15, with a significant drop on days 14 and 16. This could imply regular events or peak usage on certain days of the week.
Humidity Ratio Trends
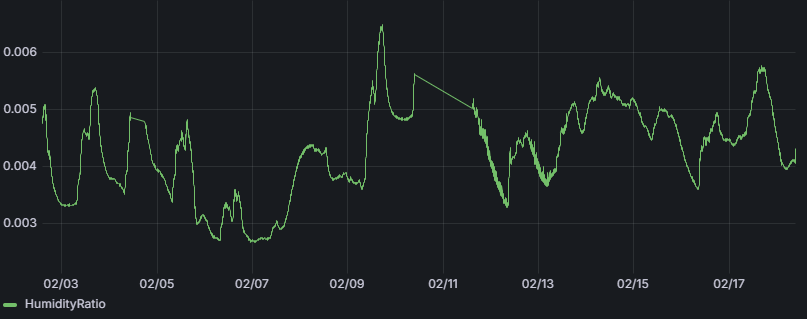
The humidity ratio over time shows variations that are less dramatic but still relevant. Peaks in this graph might align with human activity patterns as air exhaled by people contains moisture, which can affect the humidity ratio.
Conclusions
There is a correlation between light, CO2 levels, and occupancy, which could be used for smart building management.
The consistent temperature suggests an effective climate control system that possibly adjusts to occupancy.
Peak occupancy seems to be on specific days, hinting at regular events or schedules.
High CO2 levels are a concern and could be used to alert building managers to ventilate the space or limit occupancy for health reasons.
In the age of smart technology, this data is more than just numbers; it’s a tool for optimizing our living and working environments. By continuing to analyze these parameters, we can make more informed decisions that affect comfort, energy consumption, and even the health of those within the space.