The quality of the air we breathe directly impacts our health, environment, and quality of life. This article delves into the nuanced landscape of air quality across the United States, utilizing extensive data spanning from 1980 to 2022. We’ll explore the evolution of air quality, spotlight areas needing attention, and examine how population dynamics interact with air quality.
A Positive Trend with a Pandemic Twist: Understanding Air Quality Progress
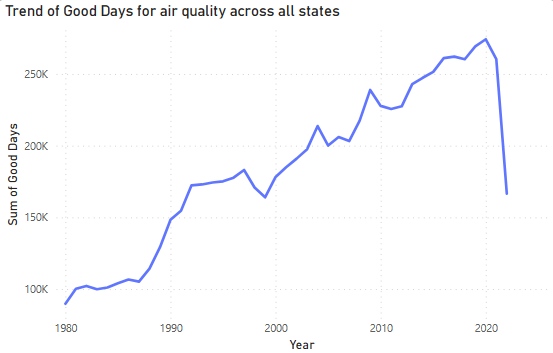
Over the past four decades, the United States has witnessed a significant upswing in the number of days classified as having good air quality. This upward trajectory, climbing from 89,803 good days in 1980 to an impressive 274,186 in 2020, mirrors the positive impacts of stringent environmental policies and advancements in cleaner technologies. Nevertheless, a notable deviation occurred in 2022, with good air quality days plummeting to 166,608. This abrupt decline, influenced largely by the global COVID-19 pandemic, highlights the complex interplay between human activity and air quality. It also underscores the importance of resilience and adaptability in our environmental strategies.
Pinpointing Pollution: States with Pressing Air Quality Issues
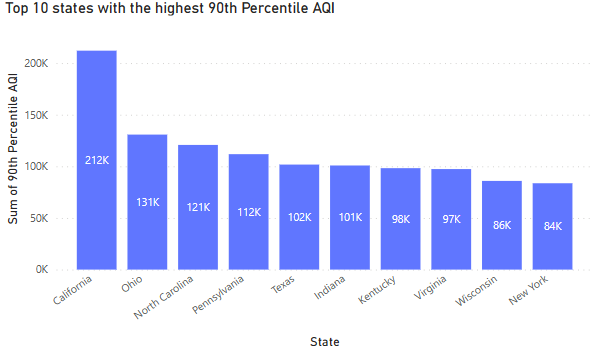
An examination of the 90th Percentile AQI data reveals a concerning pattern of pollution in states like California, Ohio, and North Carolina. These findings point to the urgent need for addressing the root causes of pollution, including industrial emissions, traffic congestion, and other anthropogenic activities. The data serves not only as a call to action but also as a guide for prioritizing interventions in the most affected areas.
The Urban-Rural Divide: Population Density and Air Quality Correlation
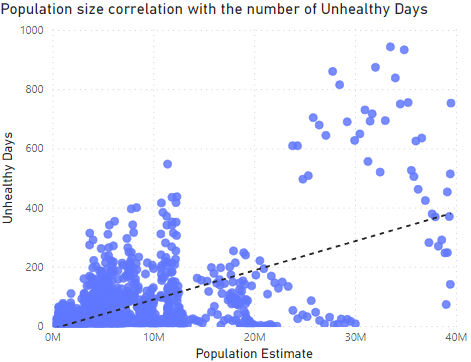
A closer look at the relationship between population size and the number of unhealthy air quality days unveils a pronounced urban-rural divide. Metropolitan areas, with their dense populations and higher industrial activity, tend to experience more days with compromised air quality. This analysis underscores the critical need for urban planning initiatives that incorporate green spaces, promote sustainable transportation, and prioritize clean air initiatives.
A Closer Look at Hazard Levels: States Facing the Greatest Challenges
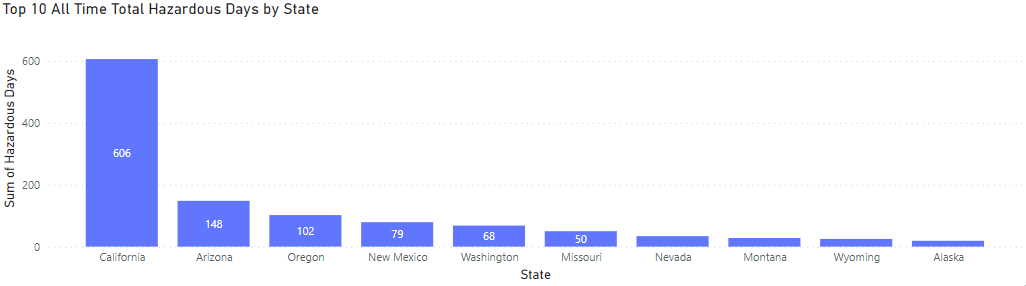
With California leading the list with 606 hazardous air quality days, followed closely by Arizona and Oregon, it’s clear that certain states face more significant challenges than others. These figures draw attention to the pressing need for targeted air quality management strategies, particularly in regions prone to wildfires and industrial pollution.
Visualizing Air Quality: The Power of Geographic Analysis
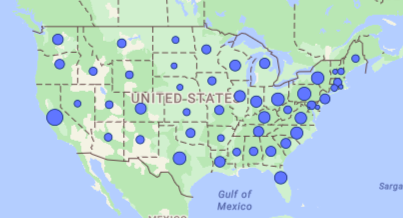
The detailed map plotting AQI days against latitude and longitude offers an insightful visual representation of air quality disparities across the country. This geographic perspective emphasizes the need for location-specific approaches to managing air quality and mitigating pollution sources.
Breathing Towards a Cleaner Future: Moving Forward with Purpose
This comprehensive review of America’s air quality underscores both the achievements and ongoing challenges in the realm of environmental health. The pandemic-induced dip in air quality good days in 2022 serves as a reminder of the delicate balance between human activity and environmental well-being. Looking ahead, it’s clear that sustained efforts, innovative environmental solutions, and a collective commitment to cleaner air are essential for building a healthier, more sustainable future.
As we chart our course towards improving air quality, it’s imperative that we leverage data-driven insights, engage communities, and advocate for policies that address the root causes of pollution. Together, we can ensure that the air we breathe supports not just our health and well-being, but also the vitality of our planet for generations to come.
1 comment on “Navigating Through America’s Air: A Comprehensive Analysis of Air Quality Trends”